Contact: Amy Vergillo
Email: amy@ecotechsolar.com
Phone: 360-488-0211
Website: ecotechsolar.com
FOR IMMEDIATE RELEASE
Community Boating Center Powers Forward with Solar Energy, Thanks to PSE Grant
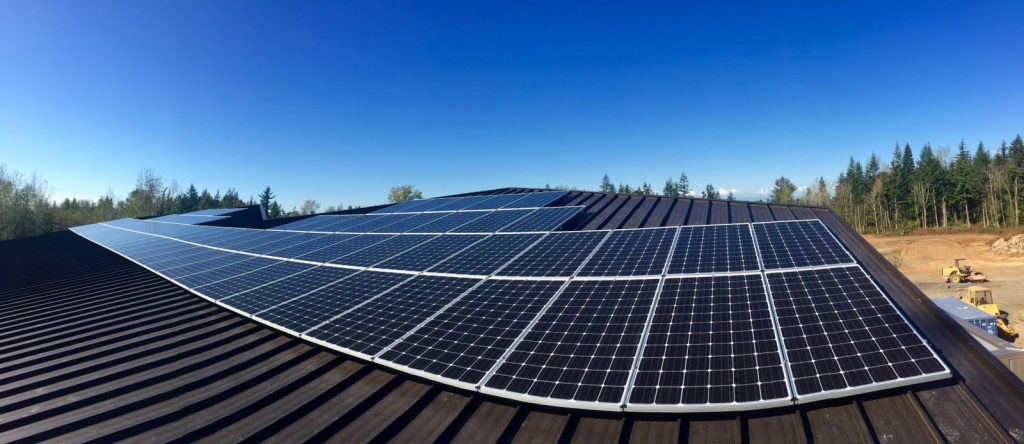
Bellingham, WA — May 1, 2025 — The Community Boating Center (CBC) will be taking a bold step toward sustainability and community empowerment by installing a solar energy system on its facilities beginning Monday, May 5, 2025. Funded by a generous grant from Puget Sound Energy’s (PSE) Green Power Community Support program, the new solar installation will not only reduce the CBC’s environmental impact but will also strengthen its mission of making boating accessible to all.
The project is designed to maximize annual energy output and offset a significant portion of the CBC’s electricity usage. With panels installed on the most optimal roof spaces, the system is expected to save the nonprofit approximately $125,000 in operating costs over the next 30 years — savings that will be directly reinvested into community programs.
This solar project also supports the CBC’s broader vision of transitioning entirely away from fossil fuels and operating on 100% solar-generated electricity. A recent milestone in this effort was the launch of a new 25-horsepower electric safety boat — a key step in decarbonizing on-water operations. The CBC is actively fundraising to build a second electric safety boat, reinforcing its commitment to clean energy both on land and on the water.
“This solar project is more than just an investment in renewable energy,” said Bryan Rust, CBC Executive Director. “It’s an investment in the people we serve. Every dollar saved on utilities will help us expand our Community Enrichment Programs, fund more scholarships, and support youth internships, especially for historically marginalized communities.”
The CBC’s Community Enrichment Programs deliver recreational therapy and marine education to a wide range of populations, including BIPOC youth and adults, local tribes, veterans, individuals with disabilities, foster youth, and people experiencing homelessness. In 2024 alone, CBC provided over $140,000 in free or low-cost programming and awarded over $15,000 in individual scholarships.
Overall, their programs have grown over 900% since 2020. Financial savings from the solar installation will allow CBC to offer even more programming, provide scholarships, support credentialing and training for youth interns, and continue building a diverse pipeline of marine educators and stewards.
A Trusted Solar Partner
The solar system, designed by Ecotech Solar, a Bellingham-based leader in renewable energy solutions with over 20 years of experience, will be installed by Ecotech Solar on May 5 – May 7, 2025. Since 2004, Ecotech Solar has installed over 1,800 solar projects across NW Washington, including several other PSE Green Power-funded projects such as installations at the Opportunity Council’s G Street Apartments and Lummi Nation School.
“We are proud to support the Community Boating Center’s efforts to create a more inclusive and sustainable future,” said Chris Poh, President of Ecotech Solar. “The CBC’s mission aligns closely with our own values of community empowerment and environmental stewardship.”
Building a Brighter, More Inclusive Future
Inclusivity has always been at the heart of CBC’s mission. Through partnerships with over 15 organizations, the CBC offers programs intentionally designed to dismantle barriers to accessing the water — barriers that have historically limited participation to privileged groups. The savings from solar energy will allow the CBC to deepen this commitment, offering more scholarships, expanding therapeutic recreation programs, and strengthening youth development initiatives.
“Solar power will fuel not just our buildings and boats, but our dreams for a more connected, diverse, and vibrant community on the water,” Rust added.


